Page 44 - Bus101FlipBook
P. 44

2-10                      Economics — A Primer                                   [CH 2


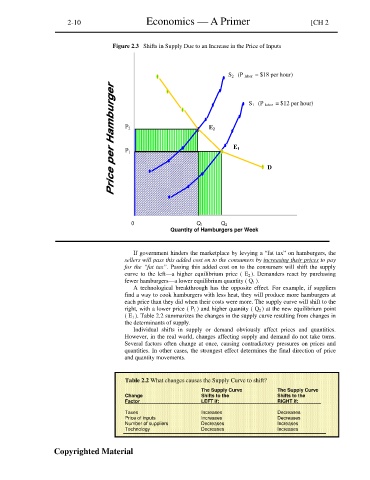
                                      Figure 2.3   Shifts in Supply Due to an Increase in the Price of Inputs


                                                                             S 2    (P  labor  = $18 per hour)


                                                                                   S 1    (P  labor  = $12 per hour)


                                          P 2                         E 2


                                                                              E 1
                                          P 1

                                                                                         D


                                            0                     Q 1     Q 2
                                                         Quantity of Hamburgers per Week


                                             If government hinders the marketplace by levying a “fat tax” on hamburgers, the

                                          sellers will pass this added cost on to the consumers by increasing their prices to pay
                                          for the “fat tax”. Passing this added cost on to the consumers will shift the supply
                                          curve to the left—a  higher  equilibrium price  (  E 2 ). Demanders react by purchasing
                                          fewer hamburgers—a lower equilibrium quantity ( Q 1 ).

                                             A technological breakthrough  has the  opposite effect. For example, if suppliers
                                          find a way to cook hamburgers with less heat, they will produce more hamburgers at
                                          each price than they did when their costs were more. The supply curve will shift to the
                                          right, with a lower price ( P 1 ) and higher quantity ( Q 2 ) at the new equilibrium point

                                          ( E 1 ). Table 2.2 summarizes the changes in the supply curve resulting from changes in
                                          the determinants of supply.
                                             Individual shifts in supply or  demand obviously affect prices and  quantities.
                                          However, in the real world, changes affecting supply and demand do not take turns.

                                          Several factors often change  at once, causing contradictory pressures on  prices and
                                          quantities. In other cases, the strongest effect determines the final direction of price
                                          and quantity movements.


                                           Table 2.2 What changes causes the Supply Curve to shift?

                                                                    The Supply Curve         The Supply Curve
                                          Change                    Shifts to the            Shifts to the
                                          Factor                    LEFT if:                 RIGHT if:

                                          Taxes                     Increases                Decreases
                                          Price of inputs           Increases                Decreases
                                          Number of suppliers       Decreases                Increases
                                          Technology                Decreases                Increases


                   Copyrighted Material
   39   40   41   42   43   44   45   46   47   48   49