
Page 41 - Bus101FlipBook
P. 41
CH 2] Business 101 2-7
information is vital for businesses because their survival depends on selling enough of
their product at a price sufficient to pay all of their expenses and return a profit.
Consumers are also interested in this information because their standard of living
depends upon the availability of goods and services and their relative cost.
Businesses like to predict the future purchaser demographics to position
themselves to take advantage of populations, price structures, and market demand and
supply that will insure profitability. This requires understanding the behavior of the
two participants in a market: demanders and suppliers. Let's assume you are opening a
hamburger shop near campus. How many hamburgers should you produce and what 2
price can you expect to charge your customers? What quantity will be needed and
what price should you charge next year?
The Demand Curve. Demanders are people who are willing to purchase goods and
services such as hamburgers. Their purchasing behavior in a market is termed
‘demand’. The demand schedule shows historically how much of a good or service
people will buy at different prices. The quantity of hamburgers demanded will be
affected by many things: the price of hamburgers, the price of substitute goods (such
as tacos), the price of complementary goods consumed with hamburgers (such as
soda), the income of demanders, people's preferences (tastes), and the number of demand curve
demanders in the market. The graph of different prices and quantities of hamburgers Schedule that shows the
demanded is called the demand curve. relationship between
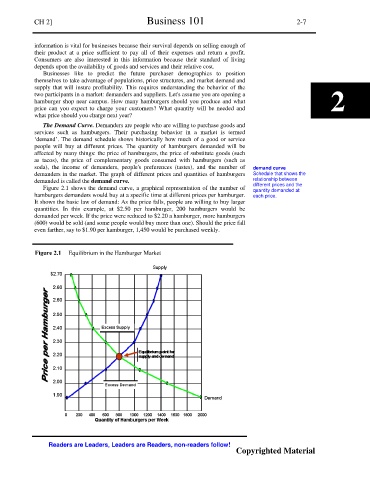
Figure 2.1 shows the demand curve, a graphical representation of the number of different prices and the
quantity demanded at
hamburgers demanders would buy at a specific time at different prices per hamburger. each price.
It shows the basic law of demand: As the price falls, people are willing to buy larger
quantities. In this example, at $2.50 per hamburger, 200 hamburgers would be
demanded per week. If the price were reduced to $2.20 a hamburger, more hamburgers
(600) would be sold (and some people would buy more than one). Should the price fall
even farther, say to $1.90 per hamburger, 1,450 would be purchased weekly.
Figure 2.1 Equilibrium in the Hamburger Market
Readers are Leaders, Leaders are Readers, non-readers follow!
Copyrighted Material