
Page 43 - Bus101FlipBook
P. 43
CH 2] Business 101 2-9
Table 2.1 What changes causes the Demand Curve to shift?
The Demand Curve The Demand Curve
Change Shifts to the Shifts to the
Factor RIGHT if: LEFT It:
Number of demanders Increases Decreases
Product preferences Increase Decrease
Income Increases Decreases
Price of substitute goods Increases Decreases 2
Price of complementary goods Decreases Increases
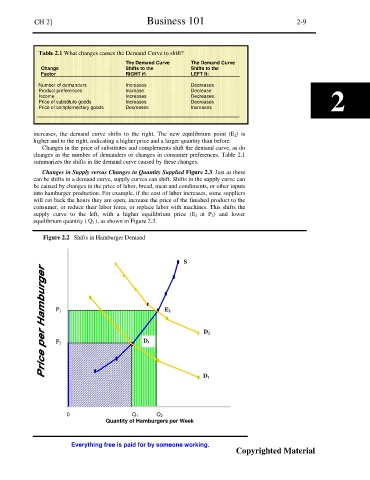
increases, the demand curve shifts to the right. The new equilibrium point (E 2) is
higher and to the right, indicating a higher price and a larger quantity than before.
Changes in the price of substitutes and complements shift the demand curve, as do
changes in the number of demanders or changes in consumer preferences. Table 2.1
summarizes the shifts in the demand curve caused by these changes.
Changes in Supply versus Changes in Quantity Supplied Figure 2.3. Just as there
can be shifts in a demand curve, supply curves can shift. Shifts in the supply curve can
be caused by changes in the price of labor, bread, meat and condiments, or other inputs
into hamburger production. For example, if the cost of labor increases, some suppliers
will cut back the hours they are open, increase the price of the finished product to the
consumer, or reduce their labor force, or replace labor with machines. This shifts the
supply curve to the left, with a higher equilibrium price (E 2 at P 2) and lower
equilibrium quantity ( Q 1 ), as shown in Figure 2.3.
Figure 2.2 Shifts in Hamburger Demand
S
P 1 E 2
D 2
P 2 D 1
D 1
0 Q 1 Q 2
Quantity of Hamburgers per Week
Everything free is paid for by someone working.
Copyrighted Material