
Page 166 - CalcBus_Flipbook
P. 166
20-10 Profitability & Performance Measures CH 20]
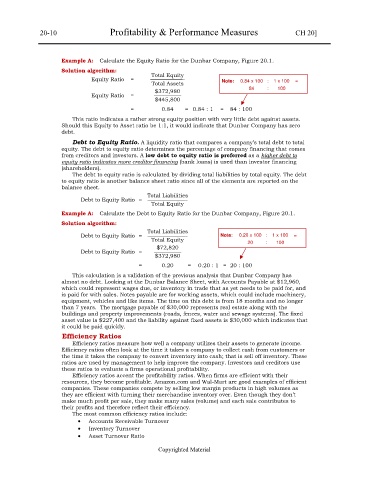
Example A: Calculate the Equity Ratio for the Dunbar Company, Figure 20.1.
Solution algorithm:
Total Equity
Equity Ratio = ——————-
Total Assets Note: 0.84 x 100 : 1 x 100 =
$372,980 84 : 100
Equity Ratio = —————
$445,800
= 0.84 = 0.84 : 1 = 84 : 100
This ratio indicates a rather strong equity position with very little debt against assets.
Should this Equity to Asset ratio be 1:1, it would indicate that Dunbar Company has zero
debt.
Debt to Equity Ratio. A liquidity ratio that compares a company’s total debt to total
equity. The debt to equity ratio determines the percentage of company financing that comes
from creditors and investors. A low debt to equity ratio is preferred as a higher debt to
equity ratio indicates more creditor financing (bank loans) is used than investor financing
(shareholders).
The debt to equity ratio is calculated by dividing total liabilities by total equity. The debt
to equity ratio is another balance sheet ratio since all of the elements are reported on the
balance sheet.
Total Liabilities
Debt to Equity Ratio = ———————-
Total Equity
Example A: Calculate the Debt to Equity Ratio for the Dunbar Company, Figure 20.1.
Solution algorithm:
Total Liabilities
Debt to Equity Ratio = ———————- Note: 0.20 x 100 : 1 x 100 =
Total Equity
$72,820 20 : 100
Debt to Equity Ratio = —————
$372,980
= 0.20 = 0.20 : 1 = 20 : 100
This calculation is a validation of the previous analysis that Dunbar Company has
almost no debt. Looking at the Dunbar Balance Sheet, with Accounts Payable at $12,960,
which could represent wages due, or inventory in trade that as yet needs to be paid for, and
is paid for with sales. Notes payable are for working assets, which could include machinery,
equipment, vehicles and like items. The time on this debt is from 18 months and no longer
than 7 years. The mortgage payable of $30,000 represents real estate along with the
buildings and property improvements (roads, fences, water and sewage systems). The fixed
asset value is $227,400 and the liability against fixed assets is $30,000 which indicates that
it could be paid quickly.
Efficiency Ratios
Efficiency ratios measure how well a company utilizes their assets to generate income.
Efficiency ratios often look at the time it takes a company to collect cash from customers or
the time it takes the company to convert inventory into cash; that is sell off inventory. These
ratios are used by management to help improve the company. Investors and creditors use
these ratios to evaluate a firms operational profitability.
Efficiency ratios accent the profitability ratios. When firms are efficient with their
resources, they become profitable. Amazon.com and Wal-Mart are good examples of efficient
companies. These companies compete by selling low margin products in high volumes as
they are efficient with turning their merchandise inventory over. Even though they don’t
make much profit per sale, they make many sales (volume) and each sale contributes to
their profits and therefore reflect their efficiency.
The most common efficiency ratios include:
Accounts Receivable Turnover
Inventory Turnover
Asset Turnover Ratio
Copyrighted Material