
Page 163 - CalcBus_Flipbook
P. 163
CH 20] Calculating Business 20-7
Fixed Assets to Fixed Liabilities Ratio. Fixed assets refer to real estate. Debt
secured by fixed assets, generally through a mortgage, are a long-term debt and a Fixed
Liability. This is generally related to real estate and its improvements. The ratio of Fixed
Assets to Fixed Liabilities indicates what portion of the assets are not encumbered by debt,
which represents a portion of equity (Assets — Liabilities (debt) = Equity). Similarly, this
measure indicates the margin of financial security that the mortgage holder has in a loan
secured by the asset. Should the business fail then the lender will receive their loan value.
The Fixed Liabilities ratio also indicates the additional amount of debt a company can
secure using its real estate as collateral. From the Dunbar Company Balance sheet, the
fixed asset value is $227,400 and the mortgage value against this asset is $30,000. This
indicates that Dunbar has paid most of the principal on the asset in the amount of
($227,400 − $30,000 =) $197,400. This value is also Dunbar’s equity in the asset. The ratio
is calculated by dividing the total fixed asset value by the total of the long-term liability and 20
in this case is:
Fixed Assets $227,400
———————— = —————— = 7.58:1
Fixed Liabilities $30,000
This means that the Dunbar has $1.00 as a long term debt for every $7.58 it has in fixed
assets. Should this long-term debt ratio be significantly lower, such as 1.2:1 or 0.6:1, then it
is important for the company to have a strong positive and steady cash flow.
Pot—Pourri Example A & B
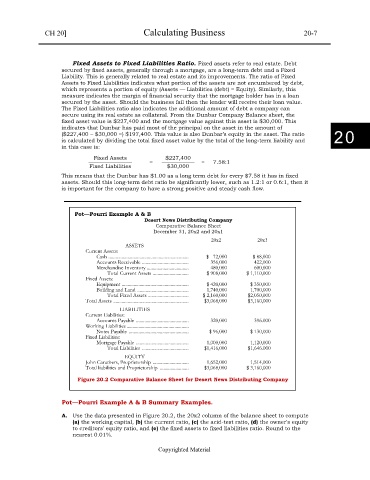
Desert News Distributing Company
Comparative Balance Sheet
December 31, 20x2 and 20x1
20x2 20x1
ASSETS
Current Assets:
Cash ................................................................... $ 72,000 $ 88,000
Accounts Receivable ....................................... 356,000 422,000
Merchandise Inventory ................................... 480,000 600,000
Total Current Assets .............................. $ 908,000 $ 1,110,000
Fixed Assets:
Equipment ........................................................ $ 420,000 $ 350,000
Building and Land ........................................... 1,740,000 1,700,000
Total Fixed Assets .................................. $ 2,160,000 $2,050,000
Total Assets ............................................................... $3,068,000 $3,160,000
LIABILITIES
Current Liabilities:
Accounts Payable ............................................ 320,000 396.000
Working Liabilities ....................................................
Notes Payable .................................................. $ 96,000 $ 130,000
Fixed Liabilities:
Mortgage Payable ............................................ 1,000,000 1,120,000
Total Liabilities ....................................... $1,416,000 $1,646.000
EQUITY
John Caruthers, Proprietorship .............................. 1,652,000 1,514,000
Total liabilities and Proprietorship ........................ $3,068,000 $ 3,160,000
Figure 20.2 Comparative Balance Sheet for Desert News Distributing Company
Pot—Pourri Example A & B Summary Examples.
A. Use the data presented in Figure 20.2, the 20x2 column of the balance sheet to compute
(a) the working capital, (b) the current ratio, (c) the acid-test ratio, (d) the owner's equity
to creditors' equity ratio, and (e) the fixed assets to fixed liabilities ratio. Round to the
nearest 0.01%.
Copyrighted Material