
Page 171 - Calculating Agriculture Cover 20191124 STUDENT - A
P. 171
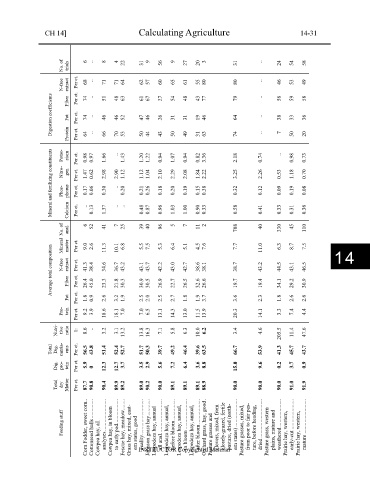
CH 14]                          Calculating Agriculture                              14-31


                      of      6  ..  8  4  22   31  9  56  9   27  20  3       31       ..    24  54  58
                      No.  trials

                      N-free  extract  Per ct.   Per ct.   68  74  ..  ..  71  51  71  48  64  63  62  61  57  67  60  27  65  54  61  48  55  43  80  77  80  79  ..  ..  46  56  53  59  49  58

                  Digestion coefficients   Fiber  Fat  Protein  Per ct.   Per ct.   74  64  ..  ..  46  66  46  70  52  53  47  50  46  44  26  43  31  50  31  49  19  31  46  63  64  74  ..  ..  38  7  33  50  36  20


                  Mineral and fertilizing constituents   Potas-  Nitro-  Phos-  sium  gen   phorus   Per ct.   Per ct.   Per ct.   0.98  1.47  0.17  0.97  0.62  0.06  1.66  2.98  0.30  ..  2.90  ..  1.43  1.12  0.20  1.20  1.12  0.21  1.22  1.04  0.26  0.94  2.10  0.18  1.07  2.29  0.20  0.94  2.08  0.19  0.82  1.84  0.15  3.36  2.22  0.38  2.18  3.25  0.32  0.74  2.26  0.12  ..  0.53  0.09  0.98  1.18  0.19  0.73  0.70  0.08


                      of  Calcium   anal.   Per ct.   ..  6  0.13  52  1.37  41  ..  7  ..  25  0.48  39  0.87  40  0.96  96  1.03  5  1.00  7  0.90  11  0.33  2  0.58  708  0.41  40  0.33  330  0.31  45  0.36  110
                      No.  Mineral  matter   Per ct.   9.0  2.6  11.3  10.1  6.8  5.5  7.5  5.3  6.4  5.1  4.5  7.6  7.7  11.0  6.3  8.7  7.5

                  Average total composition   N-free  Fiber extract   Per ct.   Per ct.   41.3  26.4  38.4  45.0  34.6  23.3  36.7  21.8  43.2  30.3  43.1  30.9  43.7  30.5  42.2  26.9  43.0  22.7  42.7  26.5  38.6  32.6  38.1  26.6  38.7  19.7  43.2  19.4  44.5  34.1  43.1  29.2  46.5  30.9   14


                        Fat  Per ct.   1.8  0.9  2.6  3.2  1.9  2.5  2.0  2.5  2.7  1.8  1.9  3.7  3.6  2.3  1.8  2.6  2.6
                      Pro-  tein  Per ct.   9.2  3.9  18.6  18.1  7.0  7.0  6.5  13.1  14.3  13.0  11.5  13.9  20.3  14.1  3.3  7.4  4.4


                    Nutri-  tive  ratio  1:   8.6  ..  3.2  3.1  13.2  13.8  16.3  7.1  5.8  6.3  10.0  6.2  3.4  4.6  205.5  11.4  47.6


                  Total   Dig.  nutria-  ents  Per ct.   56.5  43.8  51.4  52.4  52.7  51.7  50.3  39.7  49.2  46.4  39.6  63.5  66.7  53.9  41.3  45.7  43.7

                    Dig.  pro-  tein  Per ct.   5.9  0  12.3  12.7  3.7  3.5  2.9  5.6  7.2  6.4  3.6  8.8  15.0  9.6  0.2  3.7  0.9


                    Total  dry  Matter  Per ct.   87.7  90.8  90.4  89.9  89.2  ........    89.0  90.2  90.0  89.1  89.1  89.1  88.9  90.0  90.0  90.0  91.0  91.9


                              Corn Fodder, sweet corn..   Cottonseed hulls ..............    Cowpea hay, all   analyses .......................    Cowpea hay, in bloom    to early pod   Fescue hay, meadow   Grass hay, mixed, east-   ern states, good    Johnson grass hay  ............    Lespedeza hay, annual   Lespedeza hay, annual,   before bloom ...............    Lespedeza hay, annual,   in bloom ......................    Lespedeza hay, annual,   after bloom ..................   O

                      Feeding stuff           ..................    ..........................    all anal. ........................


                                                    quality


                                                 INSTRUCTOR Copyrighted Material