
Page 172 - Calculating Agriculture Cover 20191124 STUDENT - A
P. 172
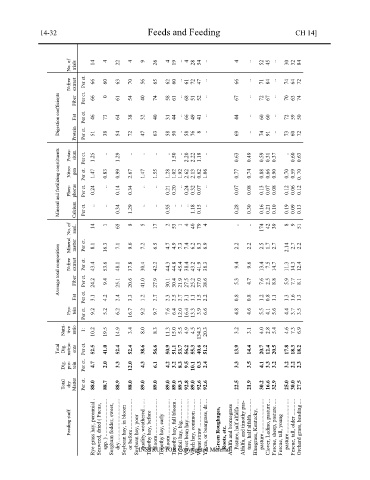
14-32                               Feeds and Feeding                                CH 14]


                        of      14  4    22  4   9   26  4  19  ..  4  28  54  ..  4  ..  52  45  ..  30  32  84
                        No.  trials

                        N-free  extract  Per ct.   Per ct.   66  66  60  0  63  61  70  54  56  40  65  74  62  58  60  61  ..  ..  61  68  72  51  47  52  ..  ..  66  67  ..  ..  71  72  84  67  ..  ..  74  70  64  63  72  74

                     Digestion coefficients   Fiber  Fat  Protein  Per ct.   Per ct.   46  51  73  38  64  54  38  72  32  47  40  63  31  58  44  50  ..  ..  66  58  49  76  41  8  ..  ..  44  69  ..  ..  60  74  60  91  ..  ..  72  73  59  60  50  72


                     Mineral and fertilizing constituents   Potas-  Nitro-  Phos-  sium  gen   phorus   Per ct.   Per ct.   Per ct.   1.25  1.47  0.24  ..  0.83  ..  1.29  0.99  0.14  ..  2.67  0.34  ..  1.47  ..  ..  1.55  ..  ..  1.28  0.21  1.50  1.02  0.20  ..  1.92  ..  2.20  2.62  0.24  2.22  2.13  0.32  1.18  0.62  0.07  ..  1.06  ..  0.63  0.77  0.07  0.49  0.74  0.08  0.59  0.88  0.13  0.31  0.66  0.07  0.37  0.90  0.08  ..  0.70  0.12  0.60  0.59  0.06  0.63  70  0.  0.12


                        of  Calcium   anal.   Per ct.   ..  14  ..  1  0.34  65  1.29  8  ..  5  ..  17  0.55  2  ..  53  ..  1  ..  4  1.18  40  0.15  79  ..  4  0.28  ..  0.30  ..  0.16  174  0.21  42  0.10  39  0.19  8  0.09  9  0.13  51
                        No.  Mineral  matter   Per ct.   8.1  16.3  7.1  9.6  7.2  6.5  4.7  4.9  7.3  7.4  6.2  8.3  6.9  2.2  2.2  2.5  1.7  2.7  2.14  2.7  2.2

                     Average total composition   N-free  Fiber extract   Per ct.   Per ct.   43.4  24.2  53.6  9.4  48.1  25.1  37.8  20.6  30.4  41.0  42.2  27.9  44.3  30.1  44.8  30.4  45.4  21.9  38.4  27.5  43.2  25.2  41.9  37.0  38.3  38.6  9.4  5.3  9.6  4.7  13.4  7.6  7.5  2.5  14.7  8.8  11.3  5.9  14.3  7.7  12.4  8.1


                          Fat  Per ct.   3.1  4.2  2.4  3.3  1.2  2.7  2.3  2.5  2.7  3.1  1.1  1.5  2.2  0.8  0.8  1.2  0.8  1.1  1.3  1.6  1.3
                        Pro-  tein  Per ct.   9.2  5.2  6.2  16.7  9.2  9.7  7.6  6.4  12.0  16.4  13.3  3.9  6.6  4.8  4.6  5.5  4.1  5.6  4.4  3.7  3.5


                      Nutri-  tive  ratio  1:   10.2  19.5  14.9  3.4  8.0  8.3  11.3  15.0  5.5  4.9  4.5  134.3  20.3  3.2  3.1  4.0  2.8  5.4  4.6  7.3  6.9


                     Total   Dig.  nutria-  ents  Per ct.   52.5  41.0  52.4  52.4  38.6  56.6  50.9  51.1  53.7  56.2  55.3  40.6  51.2  13.9  14.4  20.7  12.4  20.5  17.8  18.3  18.2

                      Dig.  pro-  tein  Per ct.   4.7  2.0  3.3  12.0  4.3  6.1  4.2  3.2  8.3  9.5  10.1  0.3  2.4  3.3  3.5  4.1  3.3  3.2  3.2  2.2  2.3


                      Total  dry  Matter  Per ct.   88.0  88.7  88.9  88.0  89.0  89.0  89.0  89.0  89.3  92.8  89.0  92.6  92.6  22.5  21.9  30.2  16.6  32.9  25.0  30.0  27.5


                                Rye grass hay, perennial .    Seaweed, dried ( Fucus,   spp. ) ...........................    Sorghum fodder, sweet,   dry  ...............................    Soybean hay, in bloom   or before  ......................    Soybean hay, poor   quality, weathered .......    Timothy hay, before   bloom ..........................    Timothy hay, early   bloom ..........................   Timothy hay, full bloom .    Trefoil hay, big   Velvet bean hay  Vetch h
                        Feeding stuff                        ................    ...............    Pasture, half alfalfa .....


                                               INSTRUCTOR Copyrighted Material