
Page 153 - CalcBus_Flipbook
P. 153
CH 18] Calculating Business 18-17
Corporate Debt
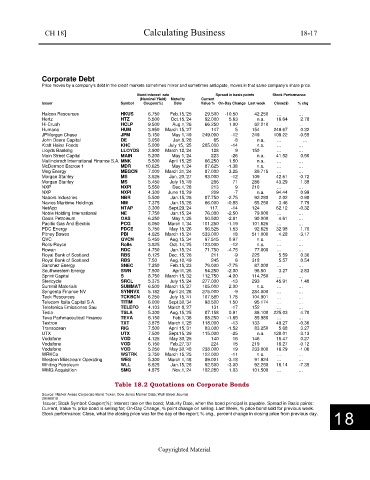
Price moves by a company’s debt in the credit markets sometimes mirror and sometimes anticipate, moves in that same company’s share price.
Bond interest rate Spread in basis points Stock Performance
(Nominal Yield) Maturity Current
Issuer Symbol Coupon(%) Date Value % On-Day Change Last week Close($) % chg
Halcon Resources HKUS 6.750 Feb.15,’25 29.500 -10.50 42.250 … …
Hertz HTZ 5.500 Oct.15,’24 92.000 5.63 n.a. 16.64 2.78
Hi-Crush HCLP 9.500 Aug.1,’26 66.250 1.00 62.210 … …
Humana HUM 3.950 March 15,’27 147 5 154 249.67 0.32
JPMorgan Chase JPM 5.150 May 1,’49 249.000 -12 249 109.22 -0.55
John Deere Capital DE 3.050 Jan.6,’28 65 -8 n.a. … ...
Kraft Heinz Foods KHC 5.000 July 15, ‘25 205.000 -14 n.a. … …
Lloyds Banking LLOYDS 3.900 March 12,’24 128 9 150 … …
Main Street Capital MAIN 5.200 May 1,’24 223 -26 n.a. 41.52 0.90
Mallinckrodt International Finance S.A. MNK 5.500 April 15,’25 66.250 1.50 n.a. … …
McDermott Escrow 1 MDR 10.625 May 1,’24 87.625 -1.38 n.a. … …
Meg Energy MEGCN 7.000 March 31,’24 87.000 3.25 89.715 … …
Morgan Stanley MS 3.625 Jan. 20,’27 93.000 -12 109 42.51 -0.72
Morgan Stanley MS 5.450 July 15,’49 286 71 286 43.29 1.38
NXP NXPI 5.550 Dec.1,’28 213 9 210 … …
NXP NXPI 4.300 June 18,’29 209 -7 n.a. 94.44 0.99
Nabors Industries NBR 5.500 Jan.15,’26 87.750 -2.75 92.280 2.02 -0.98
Navios Maritime Holdings NM 7.375 Jan.15,’26 66.000 -0.88 65.250 3.46 7.79
NetApp NTAP 3.300 Sept.29,’24 117. -14 124 62.12 -0.32
Noble Holding International NE 7.750 Jan.15,’24 76.000 -2.50 79.000 … …
Oasis Petroleum OAS 6.250 May 1,’26 90.500 -2.81 90.000 4.61 …
Pacific Gas And Electric PCG 6.050 March 1,’34 101.250 -1.19 101.625 … …
PDC Energy PDCE 5.750 May 15,’26 96.525 1.53 92.625 32.98 1.70
Pitney Bowes PBI 4.625 March 15,’24 533.000 18 511.000 4.28 -3.17
QVC QVCN 5.450 Aug.15,’34 97.515 0.97 n.a. … …
Rolls-Royce Rolls 3.625 Oct. 14,’25 123.000 -12 n.a. … …
Rowan RDC 4.750 Jan.15,’24 71.750 -4.75 77.000 … …
Royal Bank of Scotland RBS 6.125 Dec. 15,’26 211 -9 225 5.59 0.36
Royal Bank of Scotland RBS 7.50 Aug.10,’49 245 6 318 5.57 0.54
Sanchez Energy SNEC 7.250 Feb.15,’23 79.000 -7.75 87.000 … …
Southwestern Energy SWN 7.500 April1,’26 94.250 -2.00 96.50 3.27 2.83
Sprint Capital S 8.750 March 15,’32 112.750 -4.00 114.750 … …
Stericycle SRCL 5.375 July 15,’24 277.000 -13 293 45.91 1.48
Summit Materials SUMMAT 6.500 March 15,’27 105.000 2.00 n.a. … …
Syngenta Finance NV SYNNVX 5.182 April 24,’28 275.000 -9 284.000 … …
Teck Resources TCKBCN 6.250 July 15,’41 107.580 1.78 104.901 … …
Telecom Italia Capital S.A. TITIM 6.000 Sept.30,’34 98.500 1.50 95.174 … …
Telefonica Emissiones Sau TELEFO 4.103 March 8,’27 131 -17 152 … …
Tesla TSLA 5.300 Aug.15,’25 87.158 0.91 86.100 225.03 4.70
Teva Parhmaceutical Finance TEVA 6.150 Feb.1,’36 88.250 -1.65 85.980 … …
Textron TXT 3.875 March 1,’25 118.000 -13 133 49.27 -0.36
Transocean RIG 7.500 April 15,’31 83.000 -1.52 83.250 5.68 3.27
UTX UTX 7.500 Sept.15,’29 115.000 -25 n.a. 128.01 -3.13
Vodafone VOD 4.125 May 30,’25 140 16 146 16.47 0.27
Vodafone VOD 6.150 Feb.27,’37 224 15 219 16.27 -0.12
Vodafone VOD 5.250 May 30,’48 238.000 19 233.000 16.29 -1.06
WRKCo. WSTRK 3.750 March 15,’25 122.000 -11 n.a. … …
Western Midstream Operating WES 5.300 March 1,’48 89.001 -3.18 91.924 … …
Whiting Petroleum WLL 6.625 Jan.15,’26 92.500 -3.00 92.250 16.14 -7.35
WMG Acquisition SMG 4.875 Nov.1,’24 102.280 1.03 101.500 … …
Table 18.2 Quotations on Corporate Bonds
Source: Market Axess Corporate Bond Ticker; Dow Jones Market Data; Wall Street Journal
20190618
Issuer; Stock Symbol: Coupon(%): Interest rate on the bond; Maturity Date, when the bond principal is payable. Spread in Basis points:
Current, Value % price bond is selling for; On-Day Change, % point change on selling. Last Week, % price bond sold for previous week.
Stock performance: Close, what the closing price was for the day of the report; % chg., percent change in closing price from previous day.
18
Copyrighted Material