
Page 152 - CalcBus_Flipbook
P. 152
18-16 Securities: Stocks & Bonds CH 18]
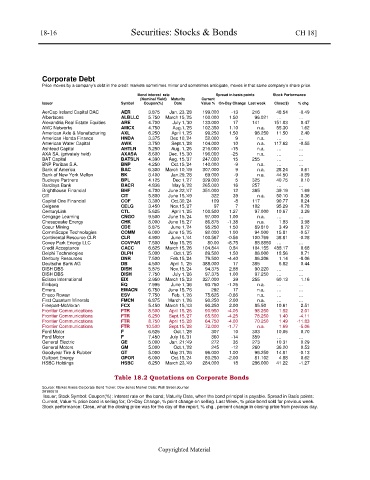
Corporate Debt
Price moves by a company’s debt in the credit markets sometimes mirror and sometimes anticipate, moves in that same company’s share price.
Bond interest rate Spread in basis points Stock Performance
(Nominal Yield) Maturity Current
Issuer Symbol Coupon(%) Date Value % On-Day Change Last week Close($) % chg
AerCap Ireland Capital DAC AER 3.875 Jan. 23,’28 199.000 -13 216 48.54 -0.49
Albertsons ALBLLC 5.750 March 15,’25 100.000 1.50 96.021 … …
Alexandria Real Estate Equities ARE 4.700 July 1,’30 133.000 17 141 151.03 0.47
AMC Networks AMCX 4.750 Aug.1,’25 102.350 1.10 n.a. 55.30 1.62
American Axle & Manufacturing AXL 6.250 April 1,’25 99.250 1.50 96.250 11.50 2.40
American Honda Finance HNDA 3.375 Dec 10,’24 52.000 9 n.a. … …
American Water Capital AWK 3.750 Sept.1,’28 104.000 10 n.a. 117.62 -0.55
Ashtead Capital AHTLN 5.250 Aug. 1,’26 216.000 -15 n.a. … …
AXA SA. (privately held) AXASA 8.600 Dec. 15,’30 196.000 -25 n.a. … …
BAT Capital BATSLN 4.390 Aug. 15,’37 247.000 15 255 … …
BNP Paribas S.A. BNP 4.250 Oct.15,’24 140.000 -9 n.a. … …
Bank of America BAC 6.300 March 10,’49 307.000 9 n.a. 28.24 0.61
Bank of New York Mellon BK 3.400 Jan.29,’28 69.000 -9 n.a. 44.50 -0.89
Buckeye Partners BPL 4.125 Dec 1,’27 329.000 5 325 40.75 0.10
Barclays Bank BACR 4.836 May 9,’28 265.000 16 257 … …
Brighthouse Financial BHF 4.700 June 22,’47 351.000 12 365 39.19 1.69
CIT CIT 5.800 June 15,’49 322 39 n.a. 50.10 0.36
Capital One Financial COF 3.300 Oct.30,’24 109 -8 117 90.77 0.24
Celgene CELG 3.450 Nov.15,’27 97 7 102 95.29 -0.78
CenturyLink CTL 5.625 April 1,’25 100.500 1.27 97.000 10.67 3.29
Cengage Learning CNGO 9.500 June 15,’24 97.000 1.00 n.a. … …
Chesapeake Energy CHK 8.000 June 15,’27 86.875 -1.38 n.a. 1.83 3.98
Coeur Mining CDE 5.875 June 1,’24 95.250 1.50 89.810 3.49 8.72
CommScope Technologies COMM 6.000 June 15,’25 92.000 1.00 94.000 15.81 -0.57
Continental Resource CLR CLR 4.900 June 1,’44 100.567 -0.56 100.769 38.81 -0.28
Covey Park Energy LLC COVPAR 7.500 May 15,’25 80.00 -8.75 88.8850 … …
Credit Acceptance CACC 6.625 March 15,’26 104.844 0.84 104.155 488.17 0.68
Delphi Technologies DLPH 5.000 Oct.1,’25 89.500 1.50 86.000 18.56 0.71
Denbury Resources DNR 7.500 Feb.15,’24 79.500 -4.40 86.206 1.14 -8.06
Deutsche Bank AG DB 4.500 April 1, ‘25 388.000 17 385 6.82 0.44
DISH DBS DISH 5.875 Nov.15,’24 94.375 2.88 90.220 … …
DISH DBS DISH 7.750 July 1,’26 97.375 1.00 97.250 … …
Edison International EIX 2.950 March 15,’23 327.000 39 255 60.13 1.16
Embarq EQ 7.995 June 1,’36 93.750 -1.25 n.a. … …
Emera EMACN 6.750 June 15,’76 292 17 n.a. … …
Ensco Rowan ESV 7.750 Feb. 1,’26 75.625 -0.86 n.a. … …
First Quantum Minerals FMCN 6.875 March 1,’26 90.250 2.00 n.a. … …
Freeport-McMoran FCX 5.450 March 15,’43 90.250 2.00 85.50 10.61 2.51
Frontier Communications FTR 8.500 April 15,’26 90.950 -4.05 98.250 1.52 2.01
Frontier Communications FTR 6.250 Sept.15,’27 65.500 -4.25 78.250 1.40 -4.11
Frontier Communications FTR 8.750 April 15,’28 64.750 -4.00 70.250 1.49 -11.83
Frontier Communications FTR 10.500 Sept.15,’28 72.000 -1.77 n.a. 1.69 -5.06
Ford Motor F 6.625 Oct.1,’28 307 10 303 10.05 0.70
Ford Motor F 7.450 July 16,’31 360 -14 359 … …
General Electric GE 5.000 Jan. 21;’49 272 35 273 10.31 0.29
General Motors GM 5.000 Oct.1,’28 245 -12 260 36.20 0.53
Goodyear Tire & Rubber GT 5.000 May 31,’26 96.000 1.00 96.250 14.81 -0.13
Gulfport Energy GPOR 6.000 Oct.15,’24 80.250 -2.00 81.102 4.88 0.62
HSBC Holdings HSBC 6.250 March 23,’49 284.000 18 286.000 41.22 -1.27
Table 18.2 Quotations on Corporate Bonds
Source: Market Axess Corporate Bond Ticker; Dow Jones Market Data; Wall Street Journal
20190618
Issuer; Stock Symbol: Coupon(%): Interest rate on the bond; Maturity Date, when the bond principal is payable. Spread in Basis points:
Current, Value % price bond is selling for; On-Day Change, % point change on selling. Last Week, % price bond sold for previous week.
Stock performance: Close, what the closing price was for the day of the report; % chg., percent change in closing price from previous day.
Copyrighted Material