
Page 158 - Calculating Agriculture Cover 20191124 STUDENT - A
P. 158
14-8 Feeds and Feeding CH 14]
TDN represents total of all digestible nutrients.
TDN = digestible protein + digestible fiber + digestible nitrogen-free extract (NFE) + (digestible fat x 2.25)
Example B Presume a 150 pound mixed ration has the following analysis, (a) what is the percent TDN in the
ration? (b) How many pounds of TDN are in this 150# ration?
Solution B
Digestible protein 7%
Digestible fat 3%
Digestible fiber 1%
Digestible NFE 70%
% %
Digestible protein ................................... 7.0 x 1 = 7.00
Digestible fat (Ether extract) .................. 3.0 x 2.25 = 6.75
Digestible fiber ...................................... 1.0 x 1 = 1.00
Digestible NFE ...................................... 70.0 x 1 = 70.00
(a) 84.75% TDN, or
84.75 lb TDN/100 lbs
Or as kg
(84.75 kg TDN/100kg)
As an equation
TDN = 7% dig. protein + (3% fat x 2.25) + 1% dig. fiber + 70% dig. NFE= 84.75%
(b) Total TDN in a ration = pounds x TDN%
= 150# x 0.8475
(b) Total TDN in a ration = 127.13 #
Computing TDN of a feedstuff
Balancing a feed ration for animals requires that the Total Digestible Nutrients be computed by multiplying the
percentage of each nutrient in the feed (protein, fiber, nitrogen-free extract [NFE], and fat) by its Digestion
Coefficient and summing these values. Feedstuffs are designated by their classification as a dry roughage, a green
roughage, a pasture, a silage, or as a concentrate. Table 14-1 at the end of this chapter is a list of a various
feedstuffs segregated by their various classifications and will be used to solve Feed’s and Feeding problems.
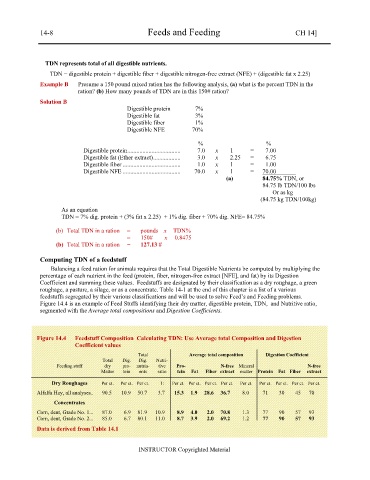
Figure 14.4 is an example of Feed Stuffs identifying their dry matter, digestible protein, TDN, and Nutritive ratio,
segmented with the Average total compositions and Digestion Coefficients.
Figure 14.4 Feedstuff Composition Calculating TDN: Use Average total Composition and Digestion
Coefficient values
Total Average total composition Digestion Coefficient
Total Dig. Dig. Nutri-
Feeding stuff dry pro- nutria- tive Pro- N-free Mineral N-free
Matter tein ents ratio tein Fat Fiber extract matter Protein Fat Fiber extract
Dry Roughages Per ct. Per ct. Per ct. 1: Per ct. Per ct. Per ct. Per ct. Per ct. Per ct. Per ct. Per ct. Per ct.
Alfalfa Hay, all analyses .. 90.5 10.9 50.7 3.7 15.3 1.9 28.6 36.7 8.0 71 30 45 70
Concentrates
Corn, dent, Grade No. 1 ... 87.0 6.9 81.9 10.9 8.9 4.0 2.0 70.8 1.3 77 90 57 93
Corn, dent, Grade No. 2 ... 85.0 6.7 80.1 11.0 8.7 3.9 2.0 69.2 1.2 77 90 57 93
Data is derived from Table 14.1
INSTRUCTOR Copyrighted Material